
 In the mad lead-up to the latest UNFCCC 21st Conference Of Partners (COP21), I thought I’d look at French weather station records to see how quickly France has been progressing toward climatological catastrophe. In particular, I wanted to see long-term trends that extend to the present.
Looking through the inventory of GHCN-Daily datasets for stations that began recording both TMAX and TMIN prior to 1930 and are still recording today, I found only 8 stations that qualified, including 3 of France’s 6 Global Climate Observing System Surface Network (GSN) stations.
I downloaded the “raw” daily data for those stations from NOAA and ran it through an Excel VBA macro that extracts annual averages and yearly extremes as JavaScript variables for an online viewer I’ve been writing (work in progress). After incorporating all this exciting data into my viewer page, I looked for recent trends.
Disappointingly, there were no recent trends to be seen.
Except for breaks during the World Wars, these 8 stations displayed near-continuous daily records…but only up to a point. Four of the stations’ records ended with the year 2000 and four with 2004. After that…blank.
By default, my viewer ignores years with more than 7 days of data missing from any month. When I opted to include years with up to 28 days missing data in any month, lo and behold, all 14 years missing from Perpigan’s 21st century record appeared:
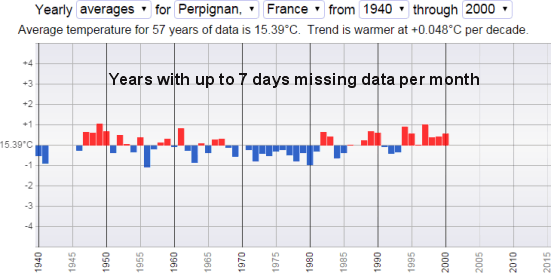
The other 7 stations displayed from 10 to 13 of the missing years.
How much data is missing? I created an Excel macro to count missing-data days for all 8 stations from January 1, 1930 to November 13, 2015 and graphed them:

Except for some shutdowns during WWII, these records are amazingly complete until 2001. No station had more than two days missing data in any year from 1946 through 2000. Then, for some in 2001 and others in 2005, the data suddenly becomes very sparse.
I then examined the 3 French GSN stations that began recording after 1929 and found the same issue. Data from Bourges Aerodrome became sparse in 2001, after which there were 74 to 246 missing days per year. Data from Mont Aigoual and Strasbourg Entzheim became sparse in 2005, after which there were 107 to 258 missing days per year.
Quite bizarre. Are the French waging war on climate records?

http://www.aigoual.asso.fr/fr/observ.php
So far, so good.
So , yes, it’s automated.
I think ‘calculateur’ can be translated as computer, although this is usually called ‘ordinateur’ for PCs or mainframes.
Well it looks like they are failing in their daily work of making CONTINUAL weather observations.
LikeLike
A link to the source of you data would be nice. I could chase it down myself but it would be a courtesy to post it and it’s always good scientific practice.
I speak French and was going to contact some of these stations but I need something more concrete than ” someone on the internet said you have holes all over your data”.
LikeLike
Thanks Greg. Sorry for the moderation delay. The data source is http://www.ncdc.noaa.gov/cdo-web/search, where different formats and subsets can be ordered, but it’s the same data as at ftp://ftp.ncdc.noaa.gov/pub/data/ghcn/daily/all/*.dly.
I’m in the process of automating the data download.
LikeLike
The web site of Mont Aigoual is completely broken. I’ve sent them an inquiry , I’ll post back if I get something.
LikeLike
Hi, I managed to get someone on the phone at the Mt Aigoual station. 😉
He said that they do not provide data directly to the public ( it’s a paying “product” ). But he did say that I could access daily data on two sites meteociel and infoclimat. So far I have not been able to find any downloadable data files but did have a look at some specific dates via their web interface.
He was able to confirm that the data is of good quality with very few breaks and suggested the problems at NOAA may be data transmission errors.
I did some digging.
http://www.meteociel.fr/temps-reel/obs_villes.php?code2=7560&jour2=7&mois2=1&annee2=2005&envoyer=OK
In particular, in the NOAA archive which gave me week data ( which is presumably averages of daily data ), I noticed that the problems started in 2005 at this station and mainly concerned the Tmin data. There were a LOT of missing data flags : 9999
I took the first one : week ending 13.02.2005 . The on line data has full hourly records for Mont Aigoual for this data. However the previous day there is a suspicious sequence of data that are identical from midnight to 6 a.m.
http://www.meteociel.fr/temps-reel/obs_villes.php?code2=7560&jour2=12&mois2=1&annee2=2005&envoyer=OK
I do not know if this reflects the original data provided by the station or whether this website is doing some form of infilling on display. Anyway, my guess is that some automatic QA checking at NOAA ( or elsewhere ) has flagged the Tmin for 12th Feb 2005 as suspect quality. This will then propagate and kill the weekly average and presumably monthly means whenever they are done.
This seems to be rather heavy handed QA where a whole week or month gets wiped off the record because of a few hours of missed data.
Then you Excel processing adopts a similar cut-off method and bingo! not more data after 2005 !!
I’m going to have a more detailed look. Back later.
LikeLike
When did the station begin reporting hourly data? That usually indicates an automated station.
LikeLike
Here we see the effect of the dodgy data for the 12th. It looks like NOAA’s QA was correct in identifying and eliminating that Tmin.
http://www.meteociel.fr/climatologie/villes.php?code=7560&mois=2&annee=2005
The problem here seems to be entire weeks or months getting thrown out because of a few hours of missing data. For example taking average Tmin of the remain 6 days of the week should be an acceptable substitute.
However, it does suggest that there is indeed a degradation in the data quality starting in 2005 since the same QA retains a continuous record before that date.
LikeLike
Is this the data source you were using?
ftp://ftp.ncdc.noaa.gov/pub/data/ghcn/daily/gsn/FR000007560.dly
Thx
LikeLike
ftp://ftp.ncdc.noaa.gov/pub/data/ghcn/daily/all/ is the source directory. On my system I must specify a specific *.dly filename for download as the directory is too large to display.
ftp://ftp.ncdc.noaa.gov/pub/data/ghcn/daily/ghcnd-stations.txt has the full listing
LikeLike
I did ask about equipment changes but no reply was forth-coming.
After a brief conversation this a.m. it looks like the guy at the station is ignoring my number and has not replied to an email enquiry. These european data gatherers are nowhere near as user friendly ( data payer friendly ) as most US academics.
UK Met Office is the same, if you want more than a pre-processed , homogenised monthly means you have to pay serious dollar. They don’t like anyone looking over their shoulder when they’re doing the cooking.
That NOAA daily .dly file only seems to go back as far as 1982, despite this being a long record station.
Metociel only go back as far as 2000 for all stations, so that’s all I could see the hourly data for. Most of the breaks seem to be total data outage for the day(s) concerned though there are very few post y2k.
88, 89 is full of holes according to NOAA but I can’t find original daily to cross-check.
LikeLike
Looking at Rennes, TAVG does not seem to go back beyond 1974, so earlier stuff is probably a Hg max/min thermometer.
The later TAVG in NOAA files in not (TMAX+TMIN)/2 so anyone making a long time series needs to be careful re apples etc.
Even comparing Tmax Hg to Tmax-hourly is questionable since Hg will be the true extrema of the day and will have large variance than hourly quantised readings.
LikeLike
Having looked at this it seems that there is not so much a case of missing data in the french records but lots of data being deleted by NOAA’s QC fitlers. The question then becomes is this an indication of a drop in quality of the french data or that changes in climate lead to the recent data having different statistics and getting incorrectly removed.
I find it a bit strange that they appear to removing a lot more TMIN values than TMAX. To understand why requires documentation of their QC processing which is not given in the readme files on the ftp site.
At a guess they will be looking at TMAX-TMIN , working out std dev for the whole record and then binning anything outside 2SD, for example.
I’ve seen this kind of thing before. Met.Office. Hadley were doing this with SST data. Around 1930-40 there were changes that were taken to indicate obvious data biases that needed “correcting”.
There was not discussion of the possibility that there may actually have been a change in climate that was responsible for a change in climate data. This is all part of the blinkered mindset that climate was completely constant until out CO2 got out of hand.
The same thing is going on with Karl et al 2015. They assume , arbitrarily, that the relationship between daytime marine air temp and NMAT must be constant and thus any variation in the difference is a data error.
You are then free to “correct” which ever temperature record displeases you and call it “bias correction” or homogenisation.
LikeLike
If you look closely at the missing data animated graph above, you’ll see a lot of missing days in 2005 at every station. Looking at the NOAA data, I see that every one of those stations has February temperature data only for the 6th, 13th, 20th, 27th, and 28th of that month, with both TMAX and TMIN only on the 6th and 28th.
Very odd. It doesn’t seem likely NOAA deleted all but those days in the 2005 Feb daily files.
There are few quality check flags in these files. However, the data source flags are interesting.
The “good” data comes from either the European Climate Assessment and Dataset (“E”) (Klein Tank et al., 2002) or the International collection (“I”) (non U.S. data received through personal contacts).
The sparse data comes from Global Summary of the Day (“S”) (NCDC DSI-9618). “S” values are derived from hourly synoptic reports exchanged on the Global Telecommunications System (GTS).
Maybe the French automated data gathering goes directly to GTS. And they have a problem with that.
Source flag for all the German data I downloaded is either “E” or “I” except for Berlin Tempelhof from 1931-1941, where “S” is indicated.
LikeLike
All the data from Mont Aigoual was marked S and they use automatic system to transfer to Meteo France, who share/sell it to others.
The French are very bureaucratic and I’d bet that is a fairly standardised system.
I also noted that the animation seems to demonstrate two changes common to several of the reference stations. 1999 and 2005. That may be some centralised change in instrumentation or information exchange.
As an example one could imagine a new brand of sensor was installed which had lower thermal capacity and thus was more sensitive to rapid changes. This would lead to larger swings in both Tmin and Tmax and if NOAA are using stats on the whole timeseries, going back to Hg min/max devices this recent data could appear to have many outliers that are outside an arbitrary 2 std dev test.
I’m guessing a bit but I think this quite a possible scenario.
If you look at the hourly data for Rennes on the period you indicated there does not seem to be any obvious problems nor missing data.
http://www.meteociel.fr/temps-reel/obs_villes.php?code2=7130&jour2=6&mois2=1&annee2=2005&envoyer=OK
LikeLike
Use the link above to look at hourly data. The 7th and 8th of Feb 2005 at Rennes did show remarkably large swing in 24h. Though there are credible and consistent data that show strong warm dry air and presumably clear skies ( I have not dug out could obs.).
This is the sort of thing that statistical automated tests will very likely eliminate as showing improbably variability. Of course excessive Tmax is what they “expect” so they keep it. Unusual cold must be wrong.
The 6th, 13th, 20th, 27th you cited are weekly intervals, Maybe some one was sending weekly means in place of daily/hourly reports.
LikeLike
I processed FR000007130.dly Rennes data file yesterday for TAVG and the only dates missing data in Feb 2005 are 29th, 30th and 31st 😉
I’ll have a look at Tmin.
LikeLike
Yes, as you said there are huge gaps in Rennes data, especially in first half of 2005. This is also the point at which status flags change from E to S , the latter being the “synoptic” hourly data.
The data clearly does exist with very few gaps as can be seen on Meteociel link so this is clearly a data transmission problem.
If WMO spend more time coordinating data collation and less time trying to model something they have not even measured properly yet, there may be more progress.
Since the TAVG data is fairly continuous I can only image this is what is being grafted onto to the old (Tmax+Tmin)/2 average. Bad science.
If this is the state of data transfer from high-tech countries like France, what hope is there of anything meaningful for Africa. And they pretend to have global averages to within 0.1 kelvin, what a joke.
LikeLike
“…dates missing data in Feb 2005 are 29th, 30th and 31st.”
That’s a relief.
LikeLike
In relation to your original objective here you could look at the trends in TAVG since about 1982 when that field becomes active. They seem pretty complete for most stations.
Last 8y have been notably cooler than the “heatwave” years of 2033-2006. In agreement with satellite TLT record.
Warmest year EVAH ? “Mon cul” as they say in France.
LikeLike
cimategrog:
Interesting. I see that Perpignan starts providing TAVG in 1973, but it’s marked in the record with an “H” measurement flag, which apparently means it’s the average of hourly high and low, not (TMAX+TMIN)/2 which it doesn’t match. Not useful for me as my Climatic Variance page requires TMAX and TMIN to show avg highs, avg lows, and annual extremes.
Now that I’ve got a better grasp of the issues involved, I’ll see if NCDC (NCEI) will answer some questions.
Yes, the “raw” data often stinks, and cooking it doesn’t make it palatable.
LikeLike
Yes, I’d cropped off the data before ’82 since it was as patchy as hell.
I had not seen the H but it appears that all the french stations TAVG must be mean of hourly since they do not match (TMAX+TMIN)/2 for the same day, which in any case would be fairly pointless to provide since TMAX and TMIN are already given.
NCEI archiving seems pretty messy here.
As I said it is possible to get a Tmax and Tmin from the hourly archives though it may be slightly inconsistent with earlier max/min Hg thermometer readings.
I did get a nice reply from the observatory but they said post 2000 daily data is only available as a paying service. No idea what one is suppose to do for the rest of the hourly data they have been diligently collecting since at least 1982 ( and less diligently before that ).
They seem very motivated to host COP21 but are still playing hide and seek with the most basic data up on which the whole games depends.
I think all WMO offices are supposed to share data with each other and charge no more than a basic delivery charge.
It would be good to ask some questions and see whether NCIE can fill in the blanks.
There is about a month break across the board. in mid 1989 This looks like it may be a system failure. That’s annoying since it prevents using a low pass FIR filter on the first 10 years of the little that is available.
LikeLike
In fact Rennes seems pretty continuous, so I could run a filter on it:
Not much AGW there then.
LikeLike
Here’s the other main GSN stations in continental France. Not much run-away AGW going on there.
LikeLike
In the 40 years of these records , there is a warming period of 10 years that raised mean temps by about 1 deg. C ( maybe 1.2 deg. in Marsielles ) . The following 20y are flat or falling.
Fitting a straight line “trend” to the full record will thus show a “warming trend” and demonstrates why fitting linear models to absolutely anything, which is the mainstay of climate science these days, is totally misleading.
It is nothing more than an attempt to support a prior assumption that there is an underlying linear change that can be arbitrarily attributed to AGW.
Global emissions have been rising exponentially throughout this period. There is nothing to support a correlation here.
LikeLike
I received a prompt reply from NOAA pretty much confirming my suppositions.
The switch to synoptic hourly source (“S”) for TMAX and TMIN occurs when MeteoFrance stops supplying temperature data to the European Climate Assessment and Dataset (“E”) for that station. At this point NOAA attempts to estimate TMAX and TMIN from the hourly data MeteoFrance supplies to airports. Estimated TMAX and TMIN should not be taken too seriously.
TAVG with the “H” flag is the average of the highest and lowest hourly temperatures for the GMT day.
TMAX and TMIN from source “E” is probably from glass thermometers, but this would need to be confirmed by MeteoFrance.
For MeteoFrance: Are stations still recording TMAX and TMIN as diligently as they once did? If so, with what equipment?
That French bureaucrats would deny public access to the climatic recording they freely provided for more than a century strongly suggests “climate change” is far from the most serious issue facing humanity.
LikeLike
Good work, and kudos to NOAA for being responsive.
<blockquote"Estimated TMAX and TMIN should not be taken too seriously.
I do not see why it should not be taken seriously. However, it should be noted , as I said above, that it will probably have a smaller range than that recorded earlier using indexed Hg min/max thermometers. So somewhat incompatible.
Thanks, the meteociel link above states that it is 6a.m. to 6 am GMT period for Tmin, Tmax.
I still think there are data transmission problems because it does not make sense for there to be these patchy TMAX/TMIN data , sometimes daily, sometimes once a week then large gaps, all from the same station in the same period.
Either they are doing readings or they have changes methods and no longer provide it. The current situation does not seem credible.
I may ask again at the local station but I want to group any questions I may have since I don’t think he will indulge me too long. I will ask whether they are still doing min/max readings beyond the automated hourly system.
LikeLike
Logically, TMAX and TMIN based on hourly data would usually have a narrower range. Temperature variations don’t happen on the hour, every hour. But any automated system should be capable of logging max and min within 10-second intervals, which is what USCRN stations do. As I read their documentation, USCRN daily records include within-10-second max and min plus two different averages, the usual min-max average plus the mean of all the 10-sec values.
In the GHCN dailies, TMAX and TMIN are not flagged as “H,” which implies they are not based on MeteoFrance hourly temperatures. If they were, then their average should equal TAVG for the 24hr period, but it mostly doesn’t. So, is TAVG the only MeteoFrance data NOAA is allowed to use as is? Makes no sense. This, and their sparseness, is why I say the synoptic TMAX and TMIN can’t be taken too seriously. Or, as the NOAA readme says, “daily values derived in this fashion may differ significantly from ‘true’ daily data” and should be used “with caution.”
LikeLike
“If they were, then their average should equal TAVG”
I don’t think so. TAVG is presumably the average of 24 values. If TMAX/TMIN are the largest and smallest of those values, then the average of those two will be different from TAVG.
I was not aware of this 10s sampling. Of course an automatic sampling system could measure every 10s and have a sample-and-hold algorithm then only retain the min and max. That should give something comparable to Hg min/max reading. If they have done it that way it should give reasonably good continuity. At least for USCRN stations. What the French are doing is anyone’s guess.
There is no meta data or change logs available for the french site via NOAA. I asked the station for info and whether the change log was available and the question got ignored.
H flag seems to be the mean of largest hourly and smallest hourly samples.
I was assuming ( arbitrarily I now realise ) that the system just did one sample on the hour, every hour. I think this is what NOAA mean could be significantly different. They are warning not to use this as a continuation of earlier TMIN/TMAX averages that were measured with Hg thermometers.
So the bottom line is that France does not have ANY continuous, consistent temperature records going back further than early 1970s.
France is one of the most technically developed countries with one of the longest and most notable histories in hard science disciplines. If they don’t have reliable, long records, who does ?
LikeLike
According to the latest v.3.22 GHCN-Daily readme (ftp://ftp.ncdc.noaa.gov/pub/data/ghcn/daily/readme.txt), which expands the meaning of the “H” flag to include TAVG, you presume correctly. The NOAA rep either didn’t read my question diligently or is misinformed. (I had mistakenly been referring to the v.3.2 readme file downloaded in January.)
The USRCRN network, dismantled by NOAA in retaliation for budget cuts, put updated temperature and precipitation readings online at 5-minute intervals (here is sensor data for the Ajo, AZ, station’s last hour). National Weather Service meteorologists in areas where it was implemented were not happy to lose it.
LikeLike